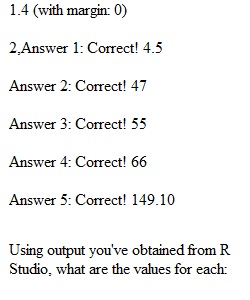
Q Question 1 2 / 2 pts Creating a Histogram and Boxplot of the Variable Speed After creating the boxplot, you may have noticed there are a few large outliers (on the right side of the horizontal boxplot). How many larger outliers are shown on the boxplot? Question 2 5 / 5 pts Obtaining Summary Statistics Using output you've obtained from R Studio, what are the values for each: minimum: 4.5 1st quartile: 47 median: 55 3rd quartile: 66 maximum: 149.10 Question 3 2 / 2 pts Summarizing Quantitative Data Between Two Groups. After obtaining the summary statistics for each group, what is the difference in medians? Take the median speed for the wood track minus the median speed for the steel track. Question 4 4 / 4 pts Creating a Table of Counts and Table of Proportions Using the table of proportions you created to fill in the blanks below Question 5 2 / 2 pts Creating a Side-by-Side Bar Chart Does there appear to be a difference in the percent of ear infections that are cleared after 14 days between the two different antibiotics?
View Related Questions